At Service Objects, one of our four Core Values is to provide excellent customer service. Part of accomplishing this goal is providing our clients with the tools they need to enhance the experience and reporting of our APIs. One of these tools available for our clients is Usage Reports.
Usage Reports is a free API that we provide to our clients to monitor transactions on their trial or production license keys. Using this tool, you can get a transaction report for each day within a given date range, a total transaction count for a given date range, or a transaction report for a single day. Using those reports, you can create powerful graphics to analyze your API usage and make informed decisions on future usage.
Let’s take a look at an example report, and what you can do with the information it produces.
Operation: GetDOTSTransactionDetailsByDateRange
This operation returns daily usage reports for a license key for a given date range. For the example license key, let’s look at usage from the week of 1/17/24 through 1/24/24:
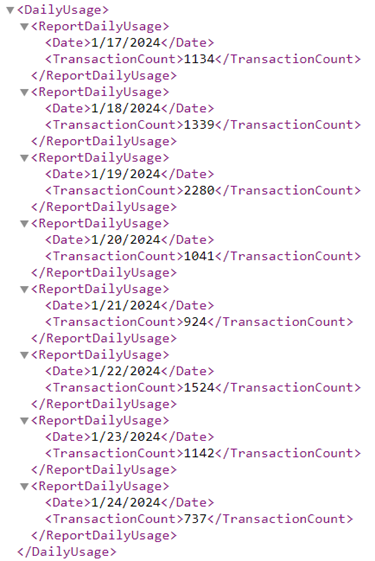
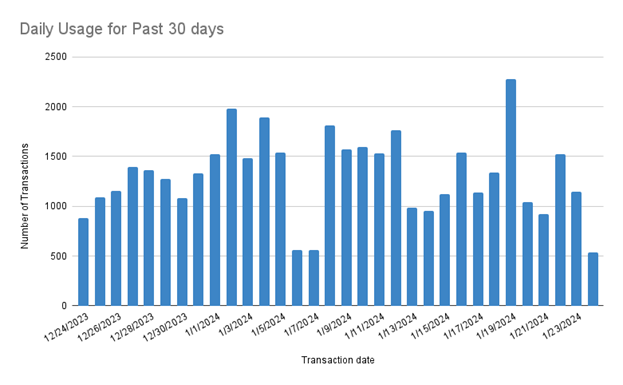
This operation returns a ReportDailyUsage object for each day of usage, including the date and the total transaction count. Next, if we expand the date range for the past 30 days and graph the usage, you can see overall transaction history behavior for that time period:
Operation GetDOTSTransactionsByDateRange
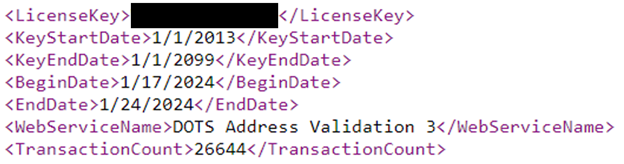
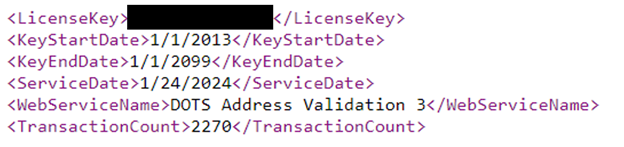
This operation returns usage reports for a license key for a given date range. It returns the license key (blurred out in below image), the date that the key was activated on, the date that the key will expire, the beginning and end dates for the transaction count, and the total transaction count for that date range.
Operation GetDOTSTransactionsByDay
Similarly to the previous operation, this operation returns usage reports for a license key for a given date. It returns the license key (blurred out in below image), the date that the key was activated on, the date that the key will expire, the date for the transaction count, and the total transaction count for that date.
This tool can be a useful way to understand and track usage trends to gain insight into how our APIs factor into your business flow. You can pinpoint dates of high transaction activity, integrate these reports into your KPIs, or simply monitor usage against your total transaction limit. Want to learn more? Feel free to reach out to our support team to see how Usage Reports can be utilized in your business.