[dropshadowbox align=”center” effect=”horizontal-curve-bottom” width=”auto” height=”” background_color=”#ffffff” border_width=”1″ border_color=”#dddddd” rounded_corners=”false” inside_shadow=”false” outside_shadow=”false” ]Important Notice: Over the past year, it has been our honor to provide enhanced COVID-19 case data to researchers and data scientists. At Service Objects, we embrace our social responsibility and recognize that we are in a unique position to help due to our superior address and geolocation data. In order to move on to the next community-driven project, we have decided to deprecate the COVID-19 data set, and all versions will be removed from our website permanently on March 9, 2021.[/dropshadowbox]
We recently announced that Service Objects has created an enhanced dataset of COVID-19 cases nationwide, which has been deduped, cleansed and appended with over 200 additional data points to assist researchers, data scientists and others in combating this global pandemic. You can read the original blog, ‘Service Objects Creates Enhanced COVID-19 Case Data‘.
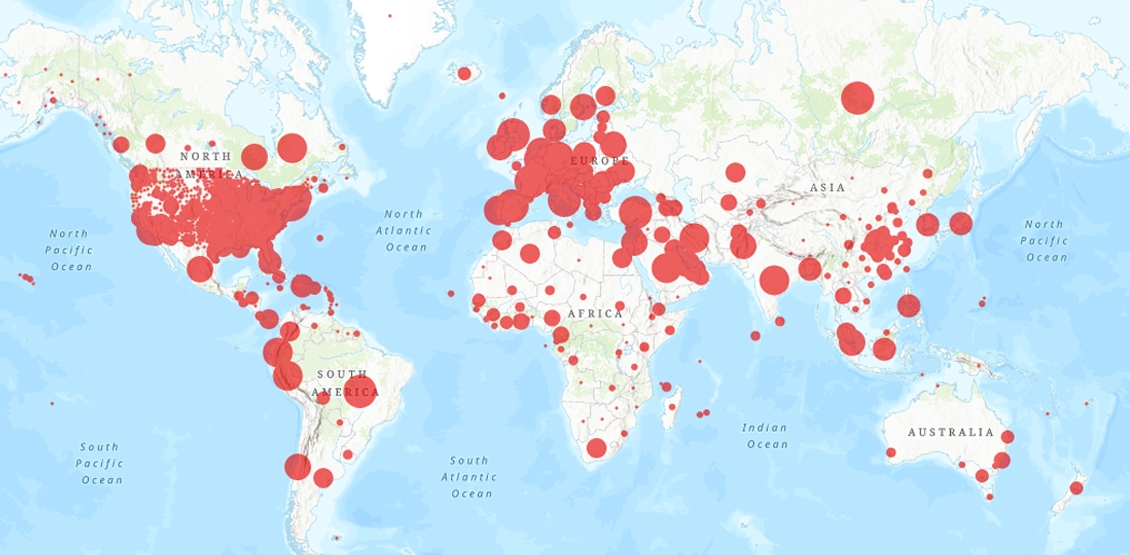
This dataset uses COVID-19 case data from the 2019 Novel Coronavirus Visual Dashboard operated by the Johns Hopkins University Center for Systems Science and Engineering (JHU CSSE). This data is broken down by US county, combined with geographic, demographic, socioeconomic, climate and other data from sources such as the US National Oceanic and Atmospheric Administration (NOAA), the US Census, the World Health Organization and others.
New data just added
Continuing our commitment to use our data to help the world get back to normal, we identified additional datasets that we feel are valuable to researchers, including:
Temperature data: We have now added 5-year monthly average temperatures for each geographic area, in degrees Fahrenheit, broken down per month. This is based on weather data from NOAA, and while this is not a database of up-to-date weather data, these 5-year averages can serve as useful predictive data.
Confirmed cases and deaths: This data has been updated with the following statistics for each area:
- Cases per 100,000 people
- Deaths per 100,000 people
- Cases per square mile
- Deaths per square mile
These data points are helper statistics for providing a better picture of hotspots during this outbreak. This is important because normal confirmed case and death statistics do not take into account population density and county area size. For example, if a county containing a major city has twice as many confirmed COVID-19 cases as a neighboring county, but also has 8 times the population as that county, this provides potentially important information on the prevalence and spread of this disease within these two counties. Likewise, if two counties have the same number of cases, but one has three times the area in square miles, this can be useful information as well.
Accessing this data
Our enhanced COVID-19 dataset has now been downloaded hundreds of times, and our hope is that these new data fields will provide even more insight into the spread of this disease. This effort is part of our commitment to use Service Objects’ data resources to help researchers and others fight this pandemic more effectively.